
Can Maths Stop Us Littering?
- The Gini Index is a graph system developed by economists to measure income inequality
- Dr. Yong Chen from EHL Hospitality Business School finds it can also be used to calculate litter distribution on beaches
- These findings can help national and local authorities curb littering and improve the efficiency of clean-up efforts
As an island nation, Britain’s coasts are an important resource. They have been a significant tourist attraction (especially domestically) since the mid-19th century. True, the 1960s kicked off a decades-spanning hiatus in which Brits, armed to the gills with sunscreen, hit the Mediterranean like a wave of gift-shop Vikings, but pandemic-induced travel restrictions and now a cost-of-living crisis have led many to rediscover the quaint charms of the good old British Seaside, and spend their summers in Cornwall rather than Crete.
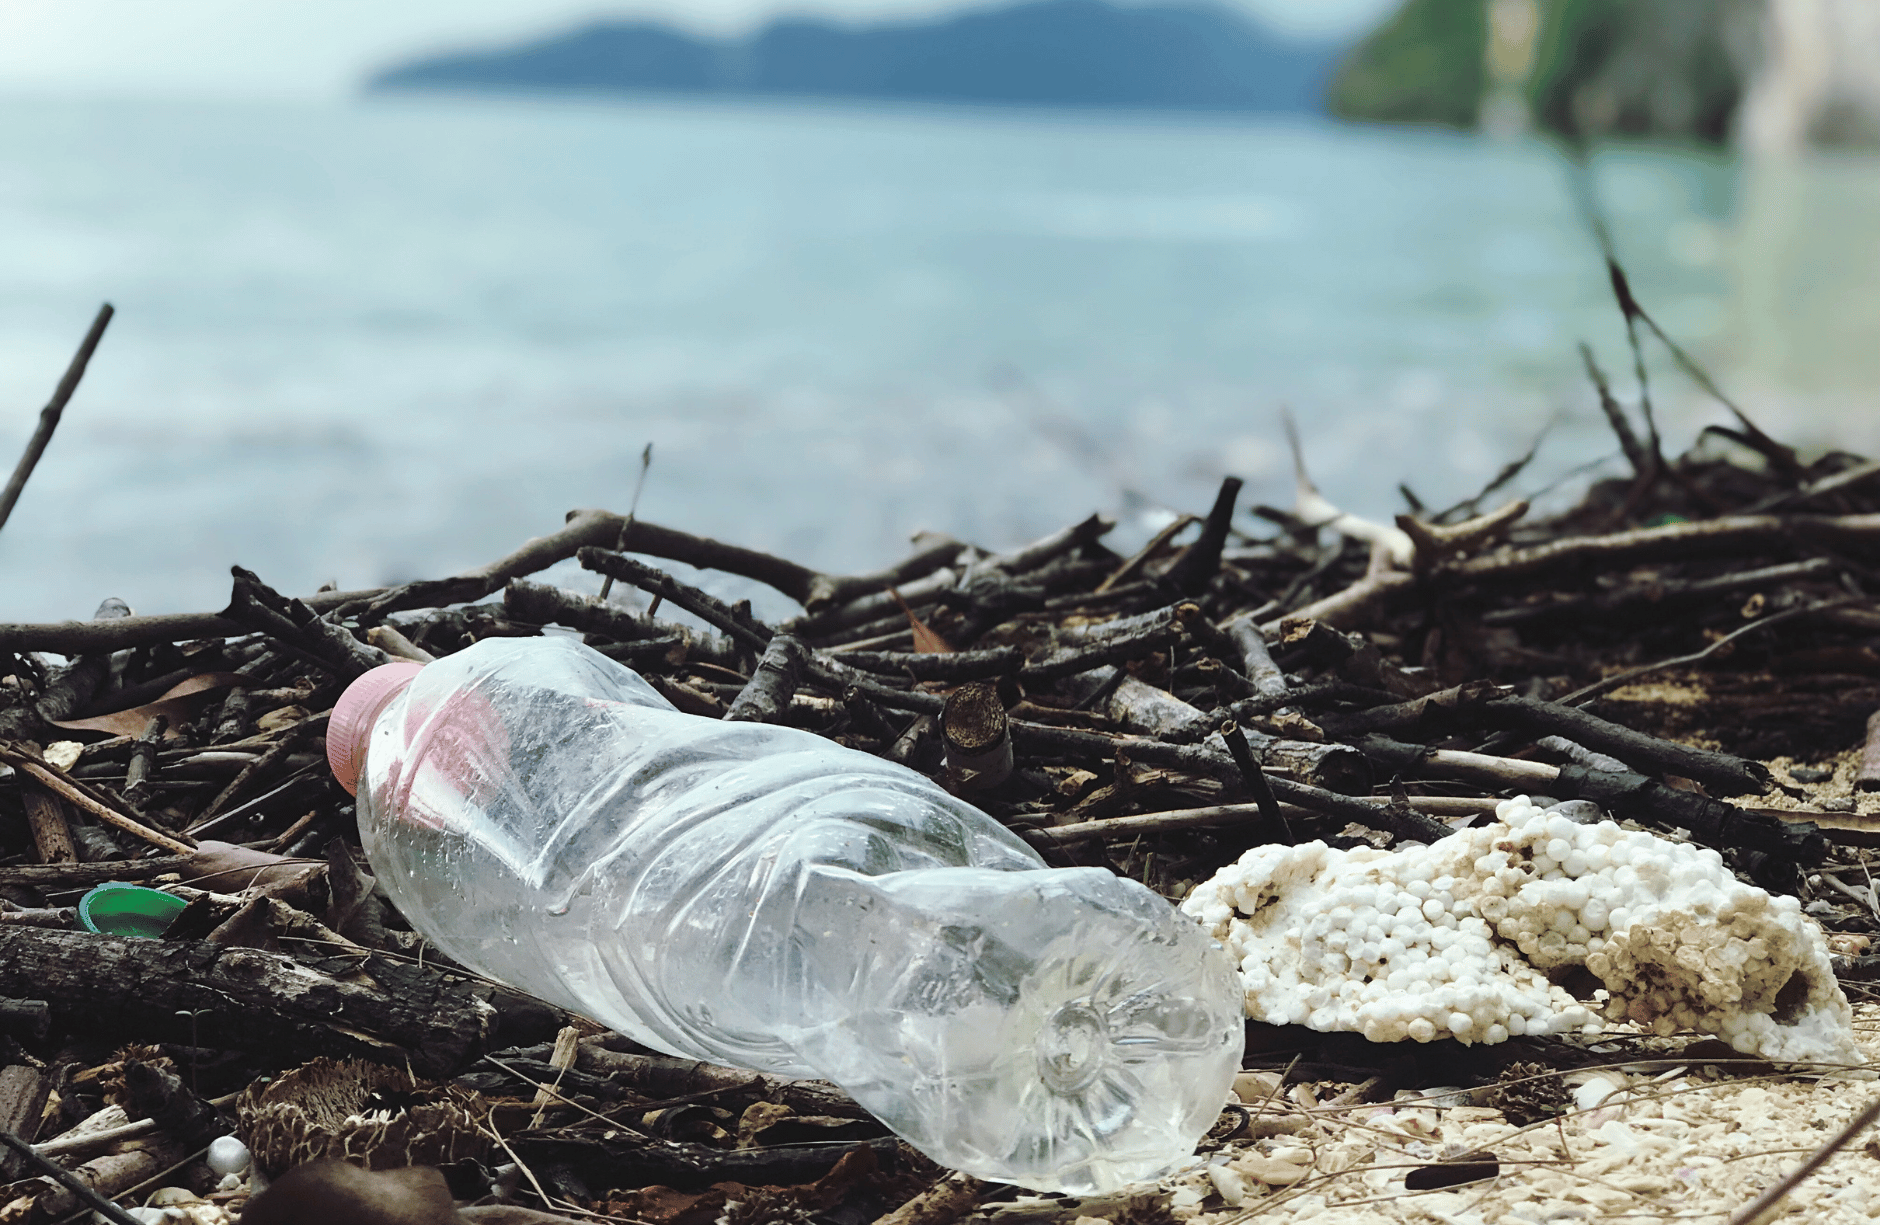
Of course, holiday-makers are unlikely to cough up their hard-earned cash if it means a week of picking their way between flotsam and jetsam – or, perhaps more accurately, Fanta bottles and jiffy bags. Littering is a common societal problem, and the waste casually left behind by tourists remains a blight upon coastal resorts not just in the UK, but in many island economies around the world.
A study published by the World Economic Forum found that eight million tons of plastic are dumped into the oceans every year, meaning seaborne plastics might outweigh all saltwater fish by 2050. This is not helped by the fact that some beach-goers take a laissez faire approach to cleaning up after themselves. The result is a diversity of scum that needs to be removed.
Research conducted in South Africa calculated that 97 percent of a beach’s value to the tourist industry could be lost if its cleanliness deteriorates. But before the issue can be tackled effectively, the abundance and distribution of litter must be measured to give policymakers the information they require to draw up cohesive clean-up strategies.
Here lies a problem. Prior research methods have focused on highlighting the prevailing sources of junk on a handful of beaches that are surveyed sporadically, says Dr. Yong Chen from EHL Hospitality Business School.
“Previous research also only dealt with one or two time intervals in longitudinal studies, ending up with a snapshot, instead of a fuller picture, of litter abundance over time,” he explains.
In his recent study, Dr. Chen proposes using the Gini Index, a graph system developed by economists to measure income inequality, to more accurately measure the spread of beach litter along the UK coastline over time.
The mysteries of advanced mathematics are someone else’s business to explain. In essence, the graph displays a rising diagonal line from the bottom left to top right corner. This represents total equality of distribution. In the case of beach littering, that would mean there is exactly the same amount of litter on all UK beaches.
A second line shows the results from survey information – the facts of the case. This line rises not as a straight line, but as a curve which droops like a hammock. Experts can calculate how unequal the distribution of litter is by measuring how far the second line sags away from the first.
In practical terms, through using the graph, Dr. Chen found that plastics, as well as being the most abundant source of littering on UK beaches, are also the most evenly-distributed. This suggests that plastic is the most visible type of refuse and that the distribution of rubbish on all beaches is driven by the distribution pattern of plastics.
Dr. Chen reveals that the majority of litter is concentrated on the south coast of England. However, sanitary products, the second most copious variety, are almost entirely concentrated in the northwest of England.
According to his findings, the amount of beach litter varies significantly from region to region across the UK. Interestingly, other factors such as weather, tide height, and the changing seasons have little to no effect on the distribution of litter.
His research is based on analysis of survey data from litter counts conducted by the Marine Conservation Society (MCS) on 1,800 UK beaches between 2000 and 2016. Dr. Chen then plotted this data on graphs to show the prevalence of certain kinds of detritus over time.
The results can be used to better inform clean-up efforts and policy decisions, he says. For instance, the visibility of plastics means that their clean-up should be a key priority, as well as certain geographical areas which are worst affected.
Properly scouring beaches of rubbish is a surprisingly expensive task. In the UK, beach cleaning undertaken by 40 percent of local authorities in 2010 cost £15.5 million. Calculating for inflation, that is the equivalent of spending just under £22 million in 2022. But, as nature cannot take care of itself, and often has limited protections legally when it comes to such pollution, the emphasis lies upon people – not just governments – to make a change.
If the cost remains high and likely to rise further before inflation is tamed, national, regional, and local authorities must ensure that clean-up strategies are as efficient as possible. The alternative is to face gradually diminishing revenues from tourism.
Never again may a pale-faced holiday-maker recline on a British beach and allow the sun to gently bronze them them like a turkey in the oven.